Bridge Report
There are 167 million crossings on 42,400 bridges rated in poor condition.
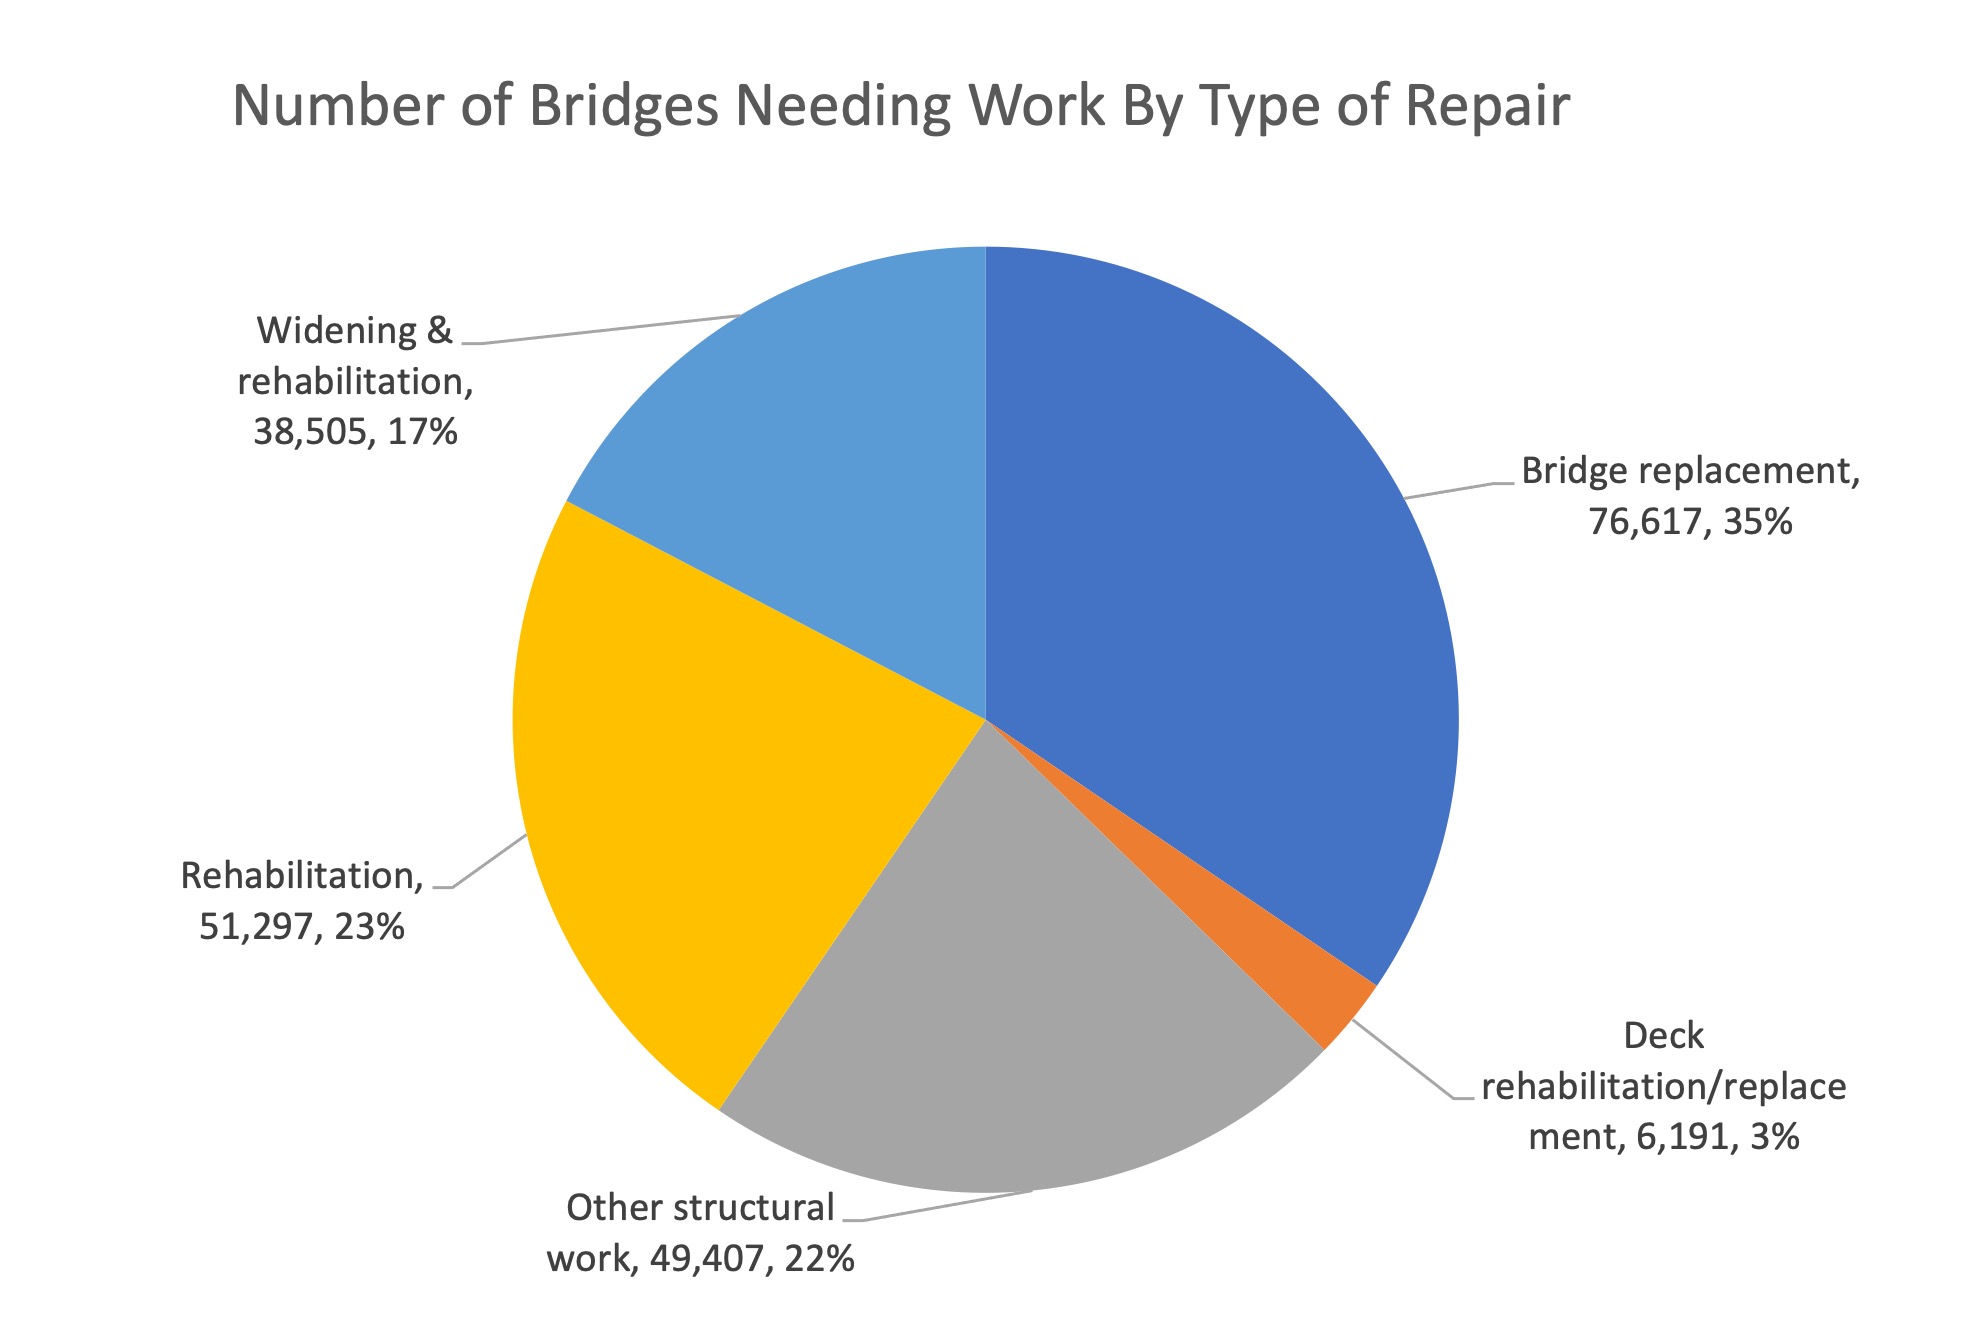
1 in 3 U.S. Bridges Needs Repair or Replacement...
New Federal Bridge Formula Program Provides Critical Resources
View Full Report
As of June 2023, states have committed 30 percent of the new bridge formula funds currently available through year two of the Infrastructure Investment and Jobs Act (IIJA).
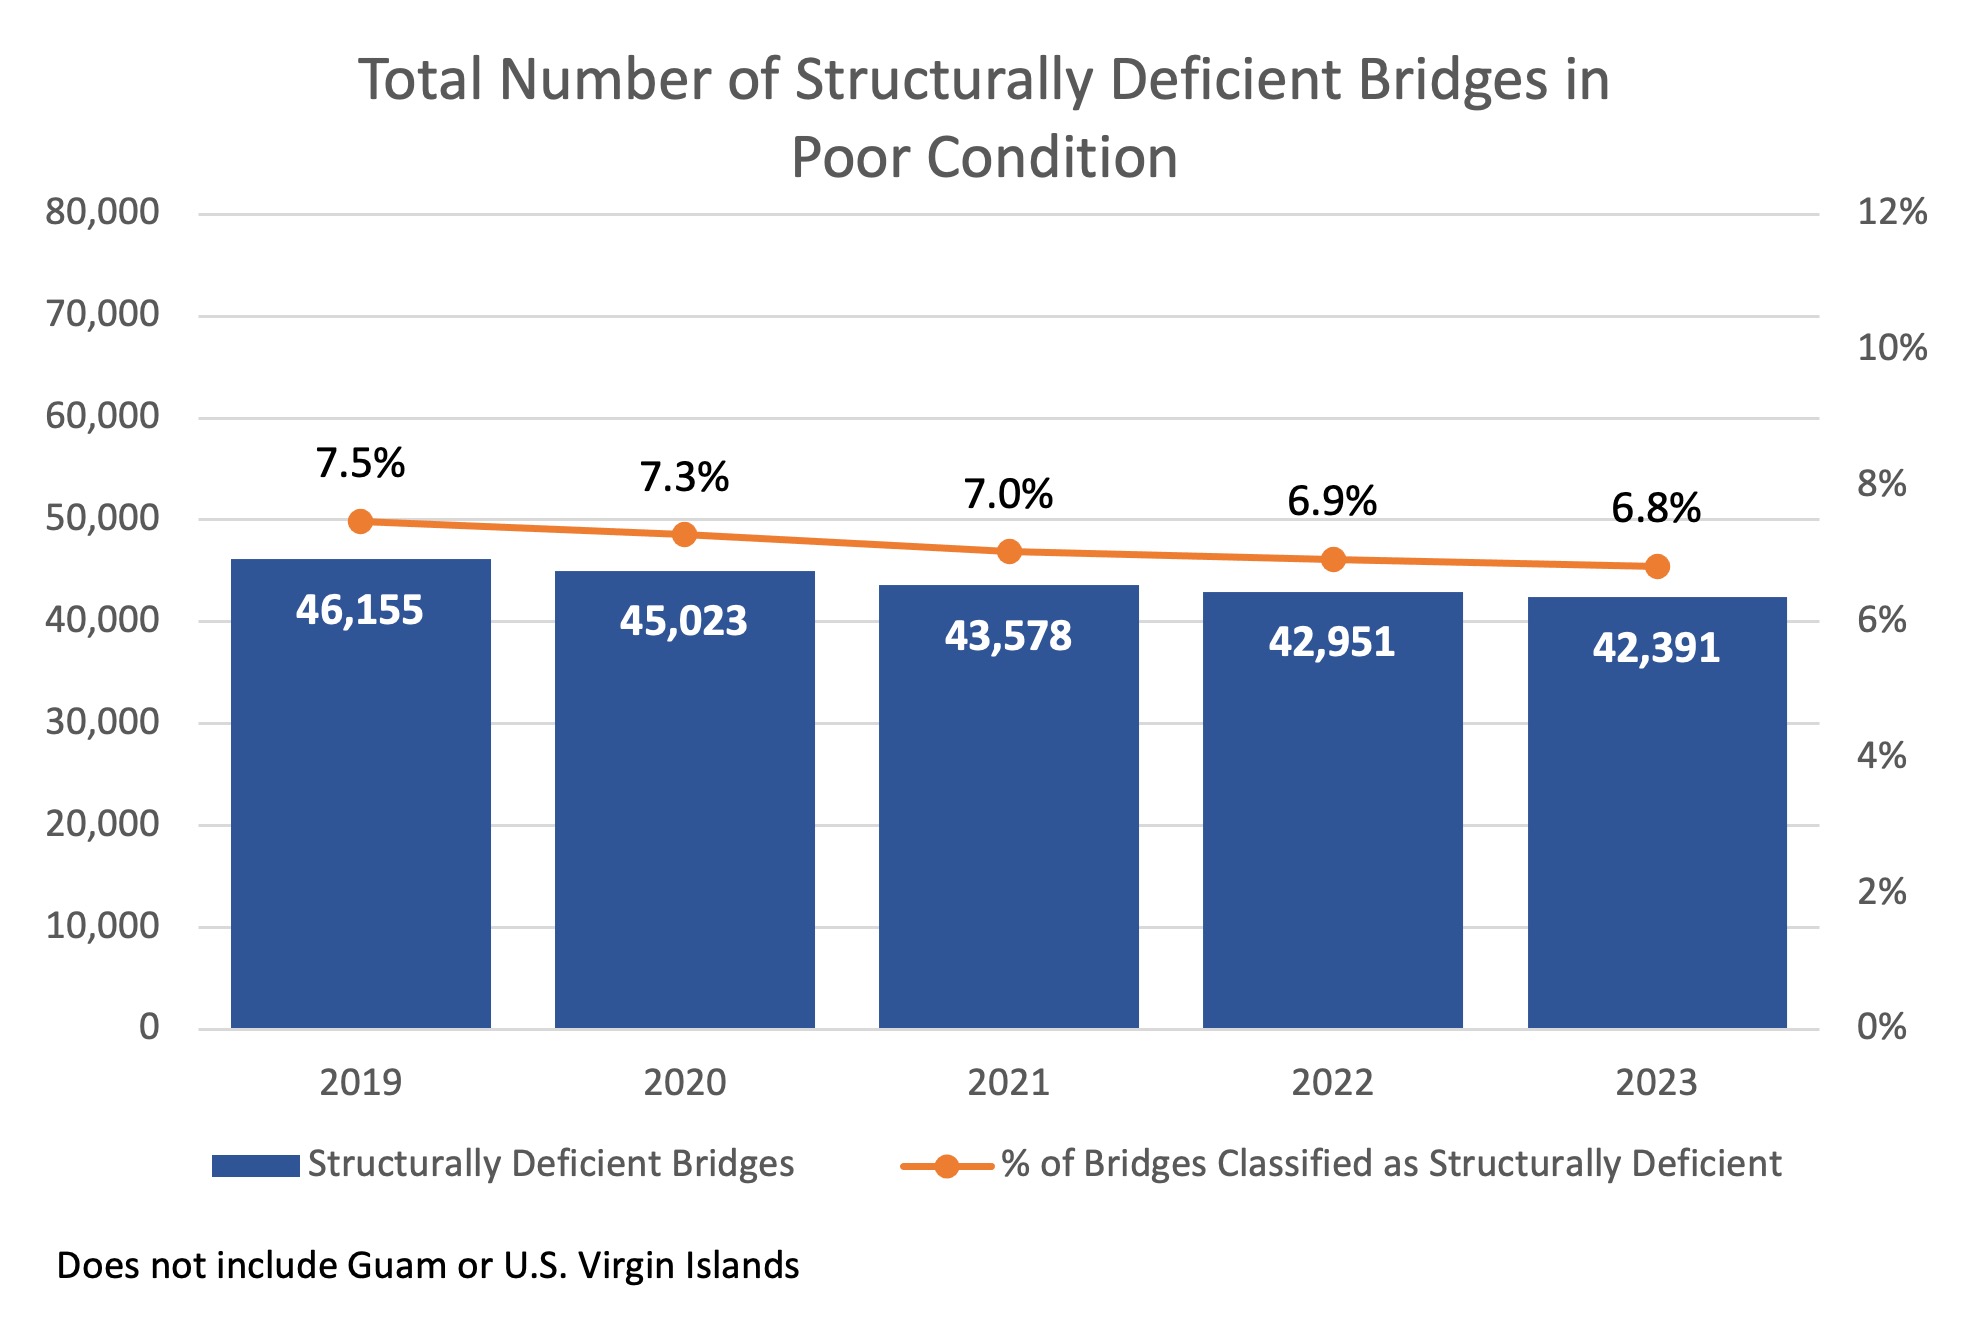
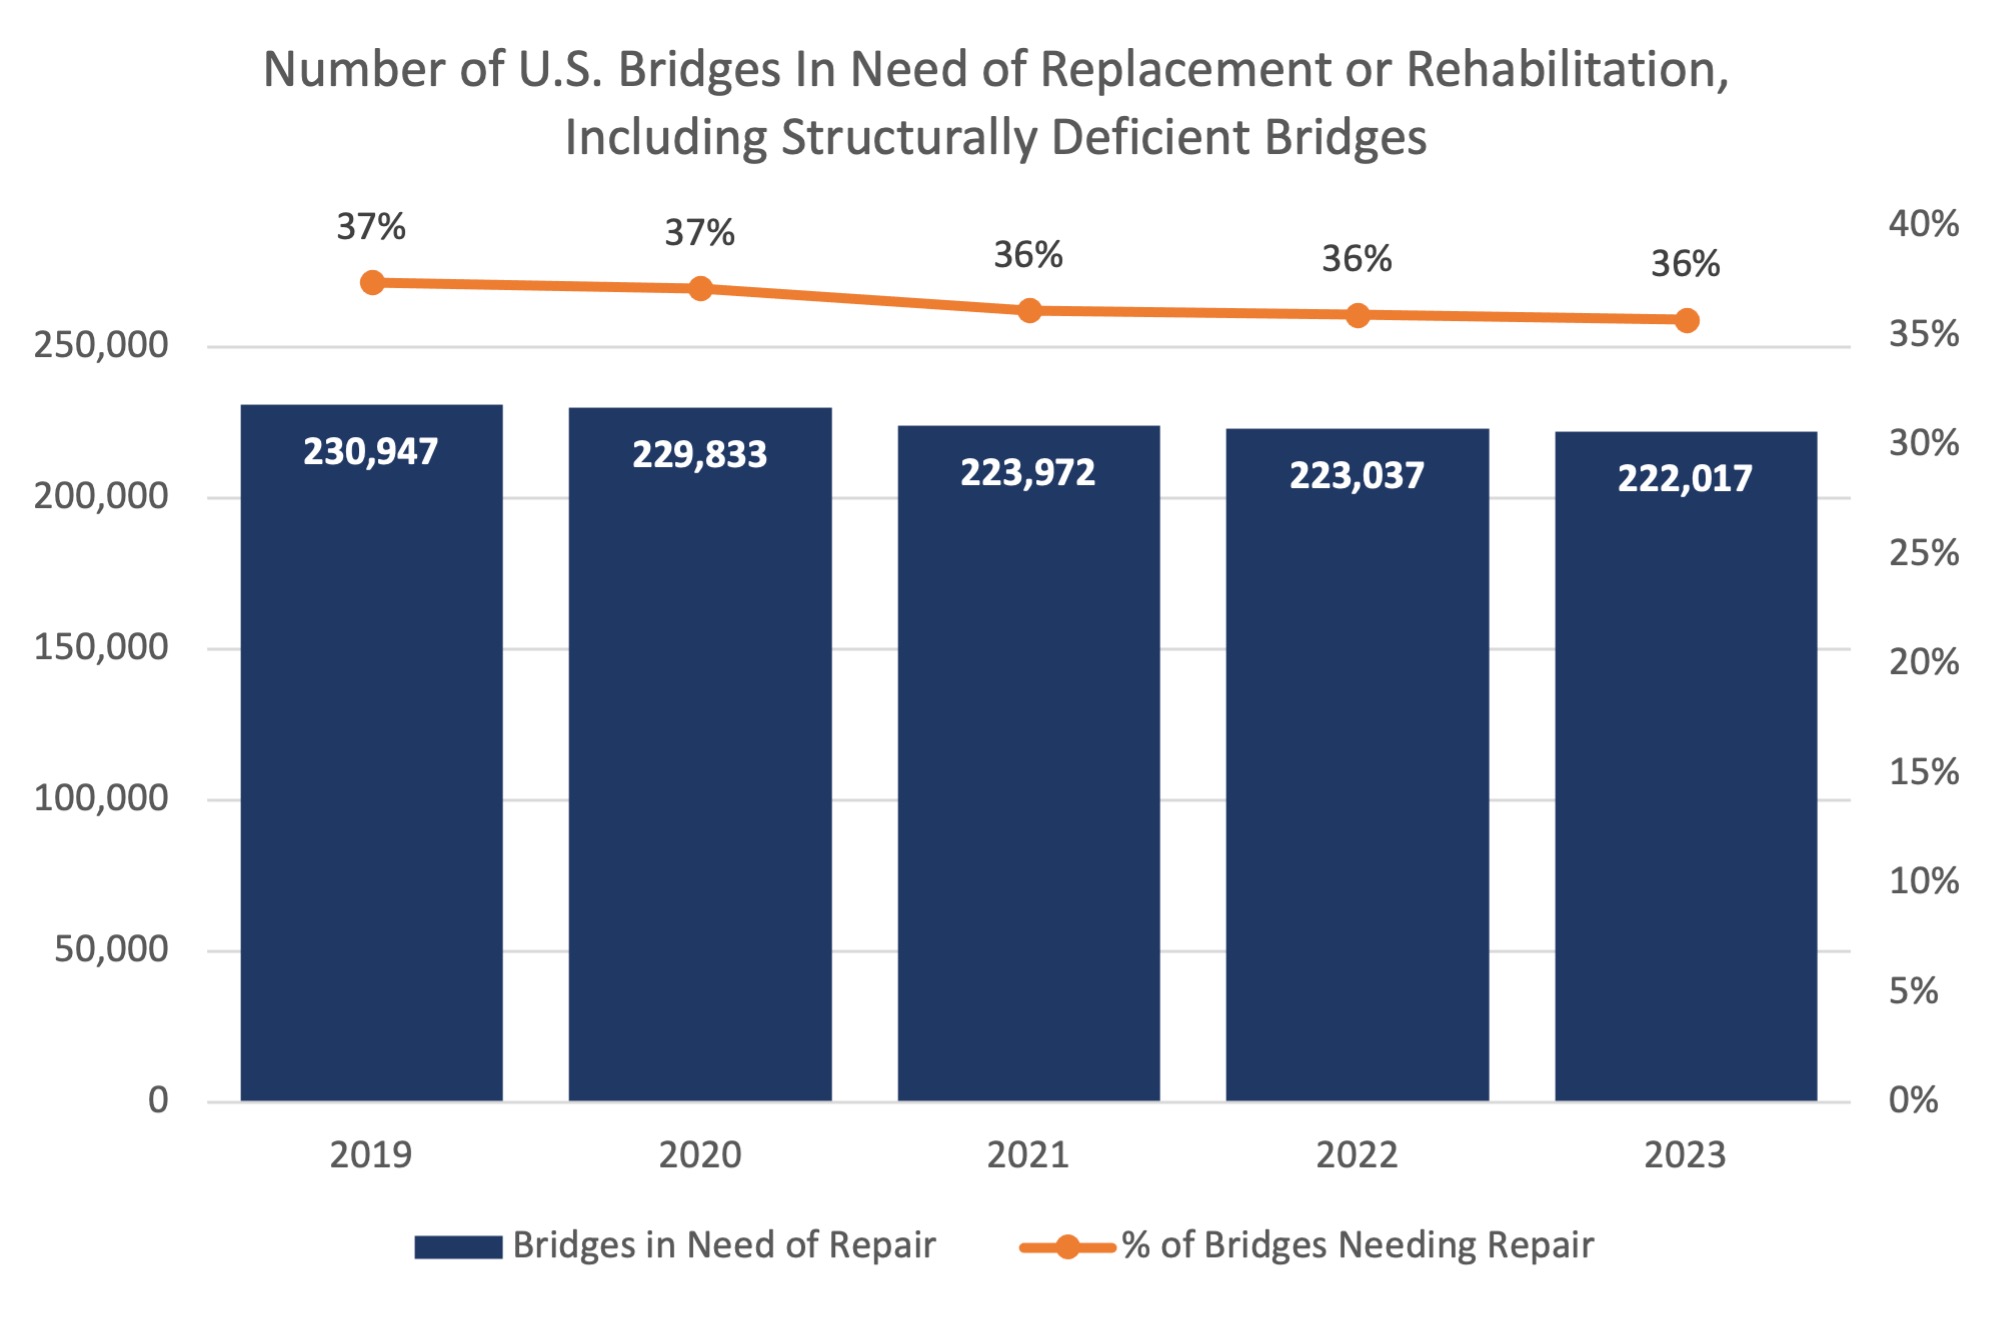
1 out of 3 U.S. bridges still needs to be replaced or repaired, even as the nation’s share of bridges in poor condition continues to slowly improve.
In addition to bridge replacements, states have identified major rehabilitation, deck repair, and bridge widening projects that will improve safety and conditions.
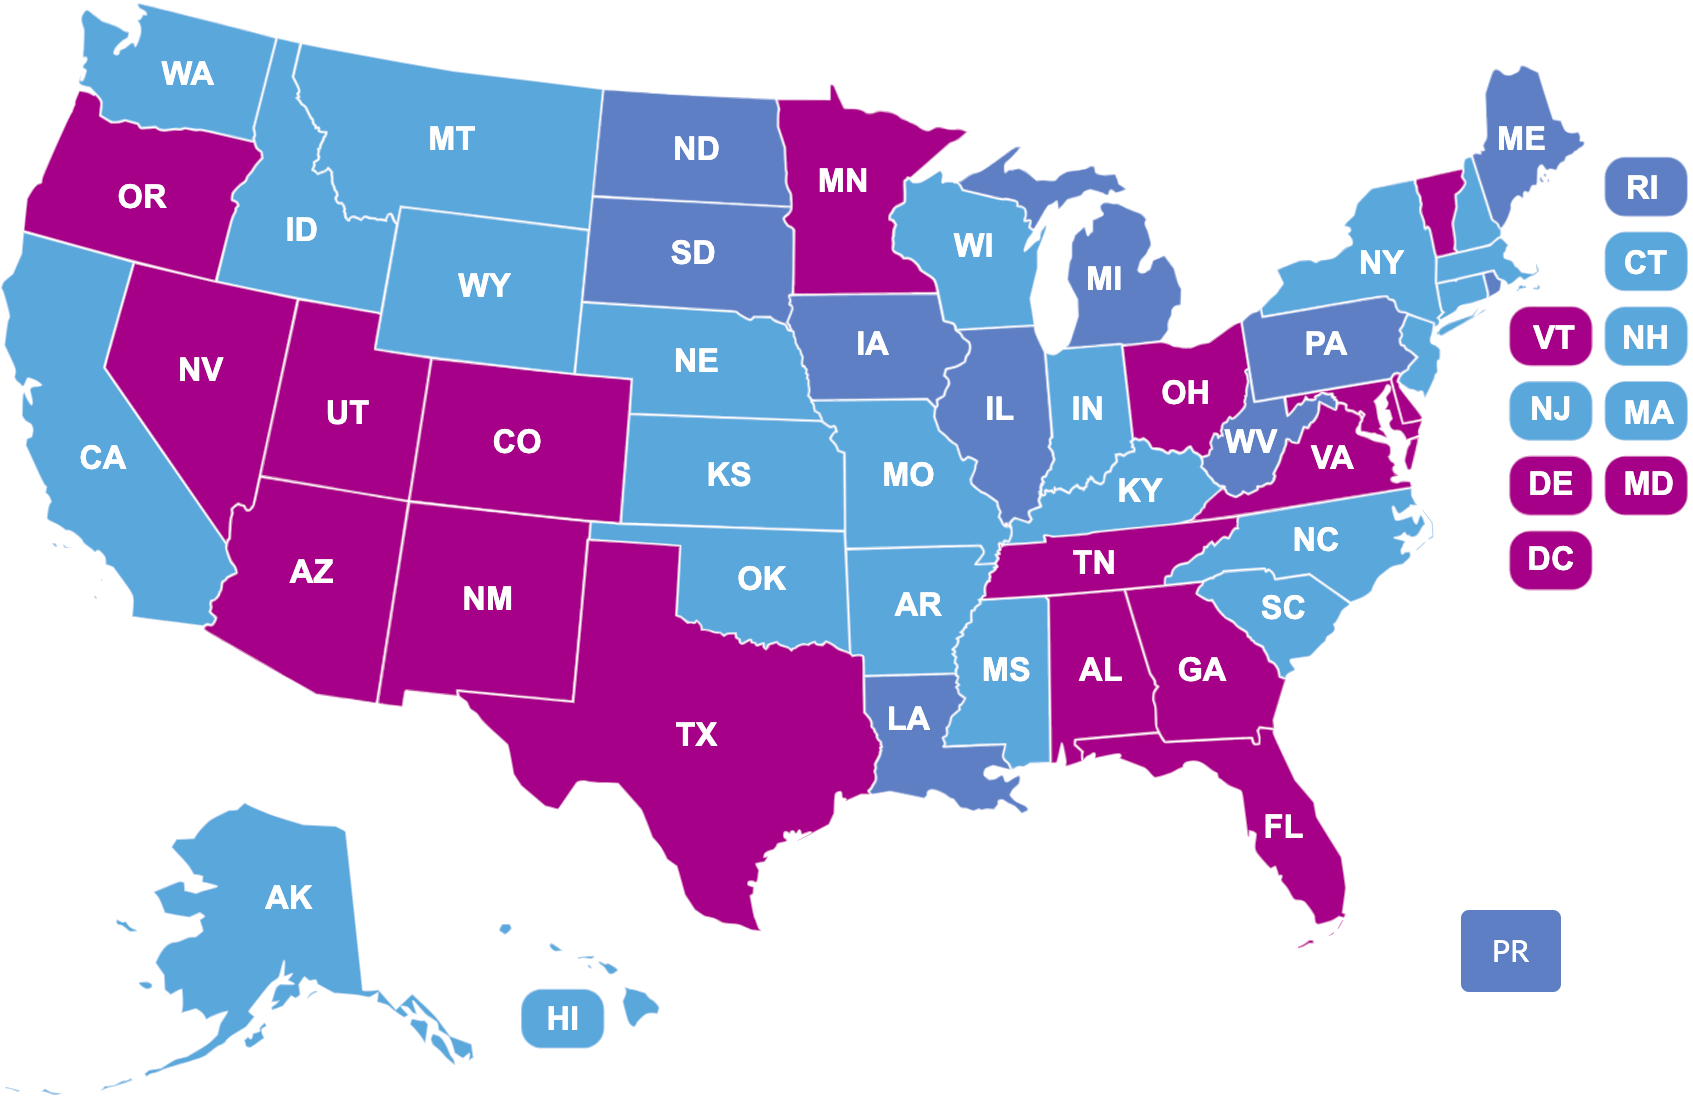
State Ranking
in % of structurally deficient bridges
| State | Rank |
|---|
| West Virginia | 1 |
| Iowa | 2 |
| South Dakota | 3 |
| Rhode Island | 4 |
| Maine | 5 |
| Pennsylvania | 6 |
| Puerto Rico | 7 |
| Louisiana | 8 |
| Michigan | 9 |
| North Dakota | 10 |
| Illinois | 11 |
| Missouri | 12 |
| New York | 13 |
| Massachusetts | 14 |
| Alaska | 15 |
| Oklahoma | 16 |
| Nebraska | 17 |
| New Hampshire | 18 |
| North Carolina | 19 |
| Kentucky | 20 |
| Montana | 21 |
| Hawaii | 22 |
| Wisconsin | 23 |
| Wyoming | 24 |
| New Jersey | 25 |
View Full Ranking
Advertisement